Viewing workflow item history

Understanding the item history chart
To view the workflow item history:
From the main menu choose Automated Workflows
Select a workflow
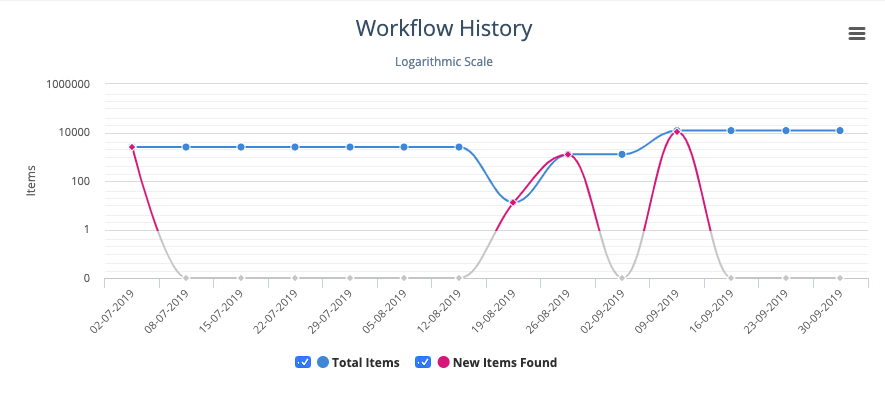
The blue line shows the total number of items found for each run of the workflow.
This is useful, for example, if you want to demonstrate the success of a cleanup project.
The pink line shows new items for each workflow run that finds new items.
Changing the scale on the vertical axis
By default, the vertical axis uses a logarithmic scale. This is useful when, for example, the blue line shows that you have a total of 10000 items and the pink line shows that a run has found two new items. In such a case, the pink line would be difficult to interpret if the chart had a linear scale.
To switch to a linear scale:
On the chart menu, select Turn off logarithmic scale
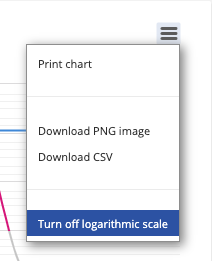
You can switch back to a logarithmic scale in the same way.
Inspecting a run on the chart
You can choose any run on the chart and drill down to investigate further.
To see the items that a run found:
Hover over the dot for that run
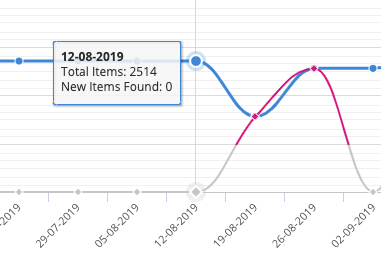
NOW Privacy shows the statistics for total items and new items found
Note the date of the run
View the items for that run