Risk dashboard
Introduction
The Risk dashboard has a set of charts that show stored information that’s likely to conflict with your data risk policies.
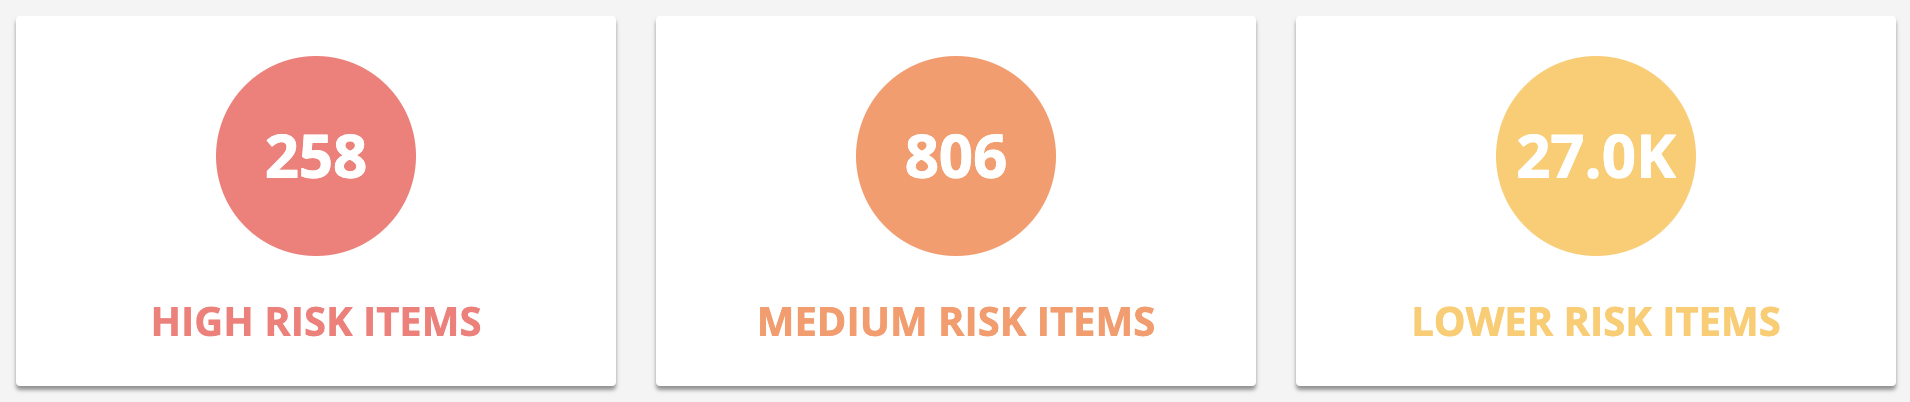
The dashboard initially presents you with three risk levels. For example:
Low: 1 to 49 items
Medium: 50 to 149 items
High: more than 150 items
 You can modify these values.
Note
1 to 49 is the typical default for low risk items. However, for people names the default is 10 to 49 because many items contain at least one name. For example, any item with the Author metadata field is likely to have a person’s name.
Click on one of the risk levels to drill down into the details.
Exploring the data
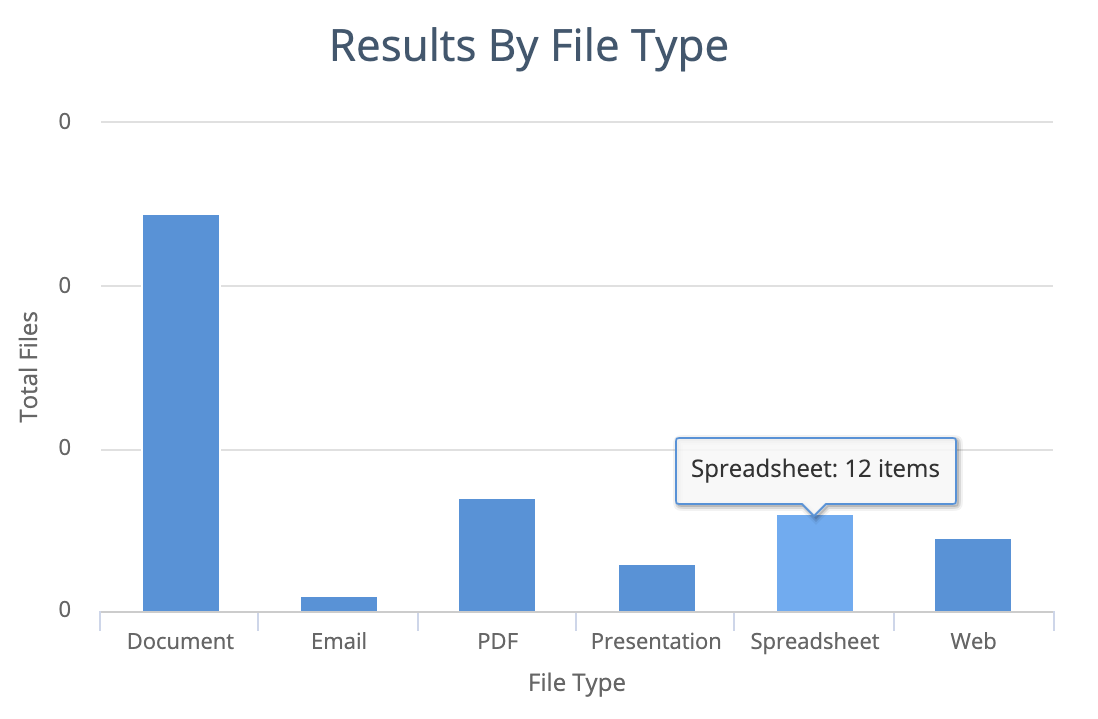
You can drill down by clicking on a chart. For example, if you click Spreadsheets on the Results by File Type chart, the dashboard changes; it will show only spreadsheets.
Look at the breadcrumbs regularly. Breadcrumbs are your friends.
The risk levels
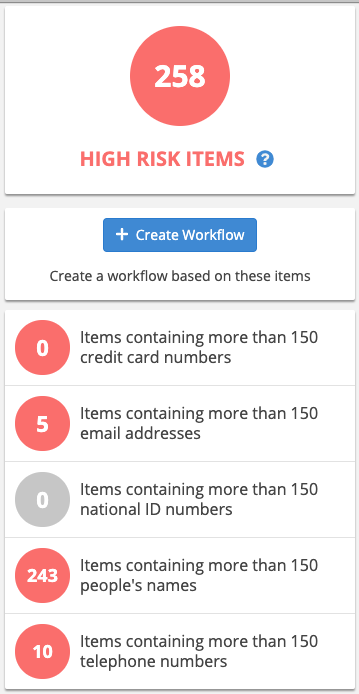
When you drill down into one of the risk levels, NOW Privacy shows you a breakdown of what it has found.
Note
The figure 258 is not the total number of items found. If one document contains more than 150 email addresses and more than 150 telephone numbers, we count it twice.
Also, if an item of PII appears twice or more in a document, NOW Privacy only counts it once.
Results by file type
Bar chart showing file types. For example:
documents
email messages
PDF files
presentations
spreadsheets
web pages
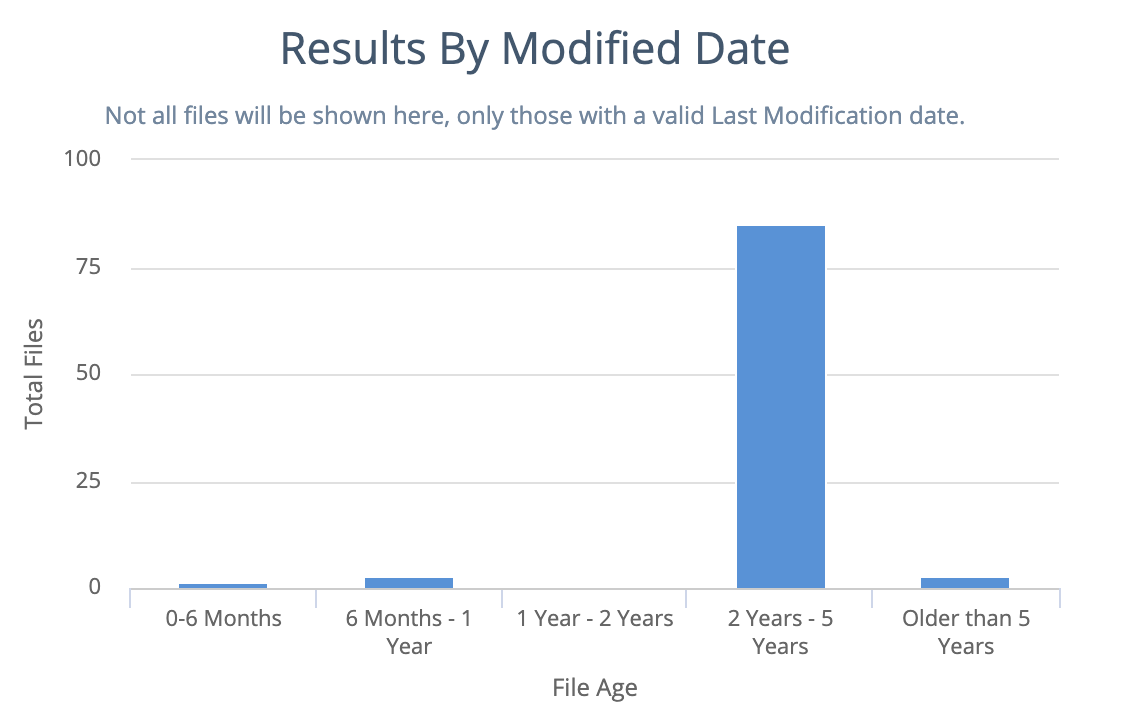
Results by modified date
Bar chart showing when files were last modified. For example, the dashboard might show that you have many files that have not been modified for more than five years.
Results by location
Venn diagram showing the location of the data. At the top level you see the data source type such as File Share or Database.
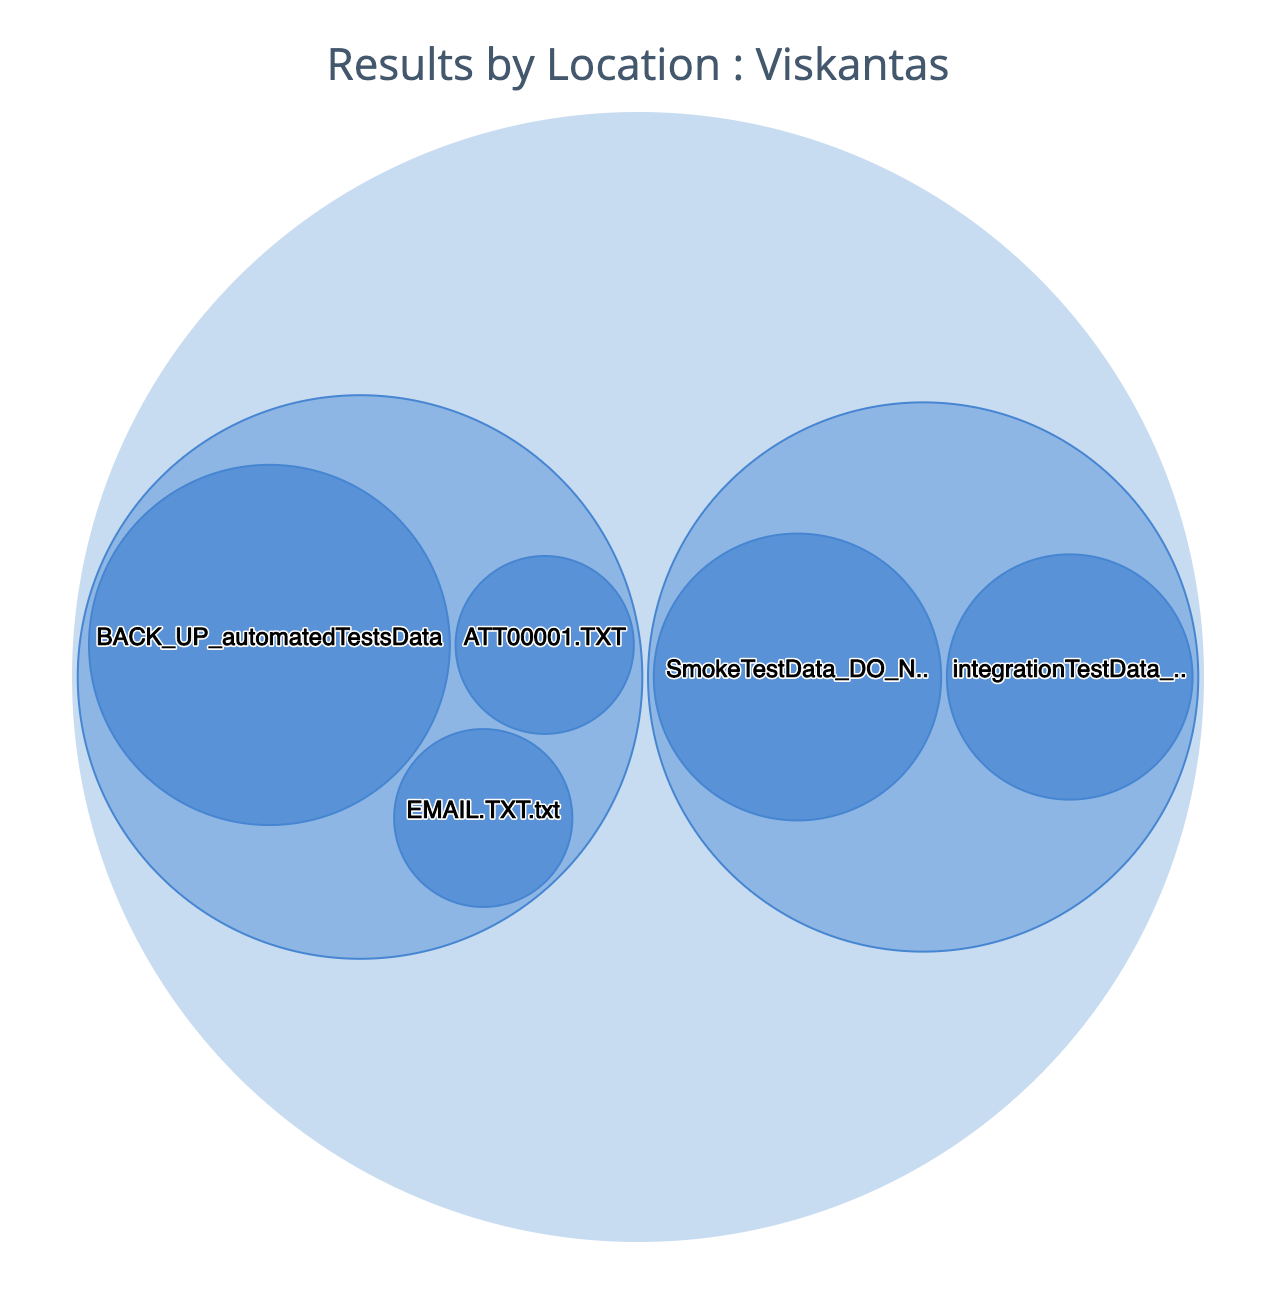
As you drill down you see the digital location of the data.
Tip
You can zoom in and out on this chart using your mouse wheel or trackpad.
Creating a workflow
We use a query to generate the results on this dashboard. Click Create Workflow to open that query in a workflow and re-use it.
Creating whitelists
Keep in mind that there are acceptable places to store sensitive data. For example, it is probably legitimate to store email addresses with your HR documents folder.
You can add locations to a white list so that items stored in safe places don’t appear on the Risk dashboard.