Creating dashboards
You cannot directly create your own dashboards. However, you can:
Take the results from Query Builder
Build something very similar to a dashboard from those results
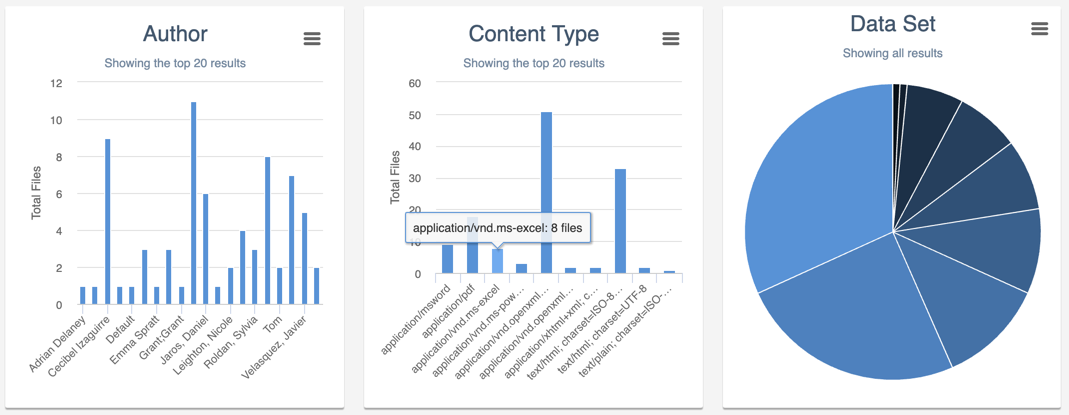
This is a great way to visualise the results of an advanced search:

To create a visualisation:
Create an advanced search
Run it
Select View ⇾ Show Visualisation
Select the chart type you’d like to use
For example, click Add a Bar Chart
Select the field you want to study
Exonar displays the chart
To add more charts:
From the Chart menu choose a chart type
Choose a field to study
Note
You cannot currently load or save the charts with the query.
 See also:
