Data Overview dashboard
Introduction
The Data Overview dashboard has a set of charts that show a general overview of your data.
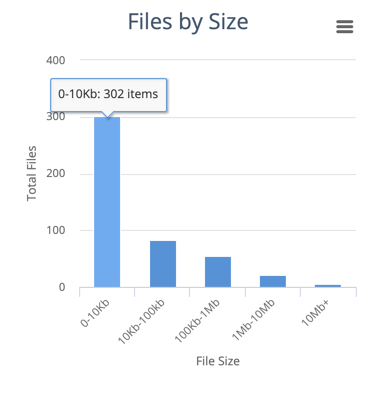
You can drill down by clicking on a chart. For example, if you click 1-10Kb on the Files by Size chart, the dashboard changes; it will show only files that are no larger than 10 KB.
Look at the breadcrumbs regularly. Breadcrumbs are your friends.
Total data
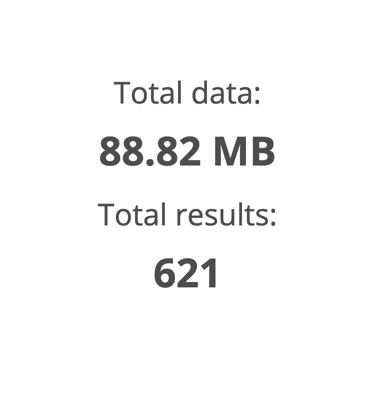
Shows basic statistics for the data currently displayed on the dashboard.
The total file size
The total number of files
As you drill down into the data by clicking on the charts, these figures change. They always represent the data the dashboard is showing.
Files by size
Bar chart showing file sizes.
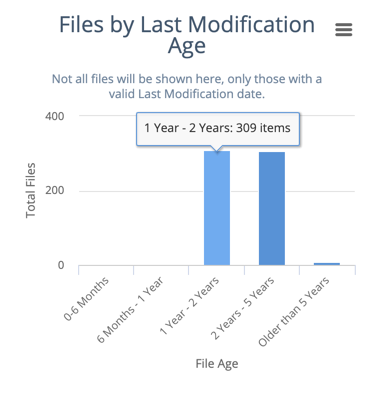
Files by last modification age
Bar chart showing when files were last modified. For example, the dashboard might show that you have many files that have not been modified for more than five years.
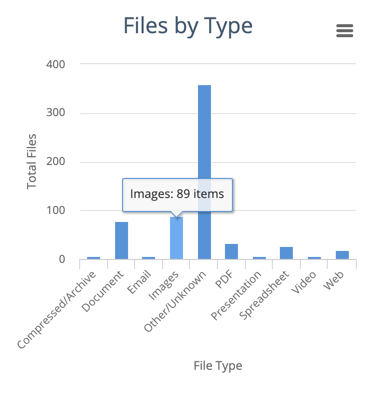
Files by type
Bar chart showing file types. For example:
documents
email messages
PDF files
spreadsheets
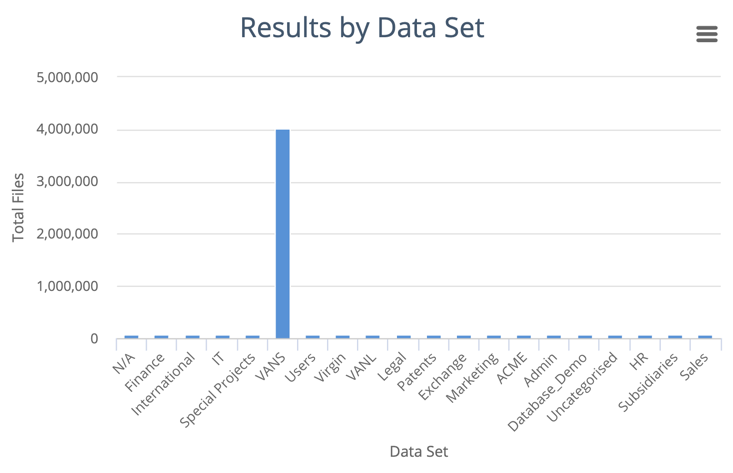
Results by data set
Bar chart showing the distribution of files in the datasets that you’ve created.
Results by location
Treemap showing the location of the data. At the top level you see the data source type such as File Share or Database.
As you drill down you see the digital location of the data, depending on the data source type. For example, for shared files you see the folder path.
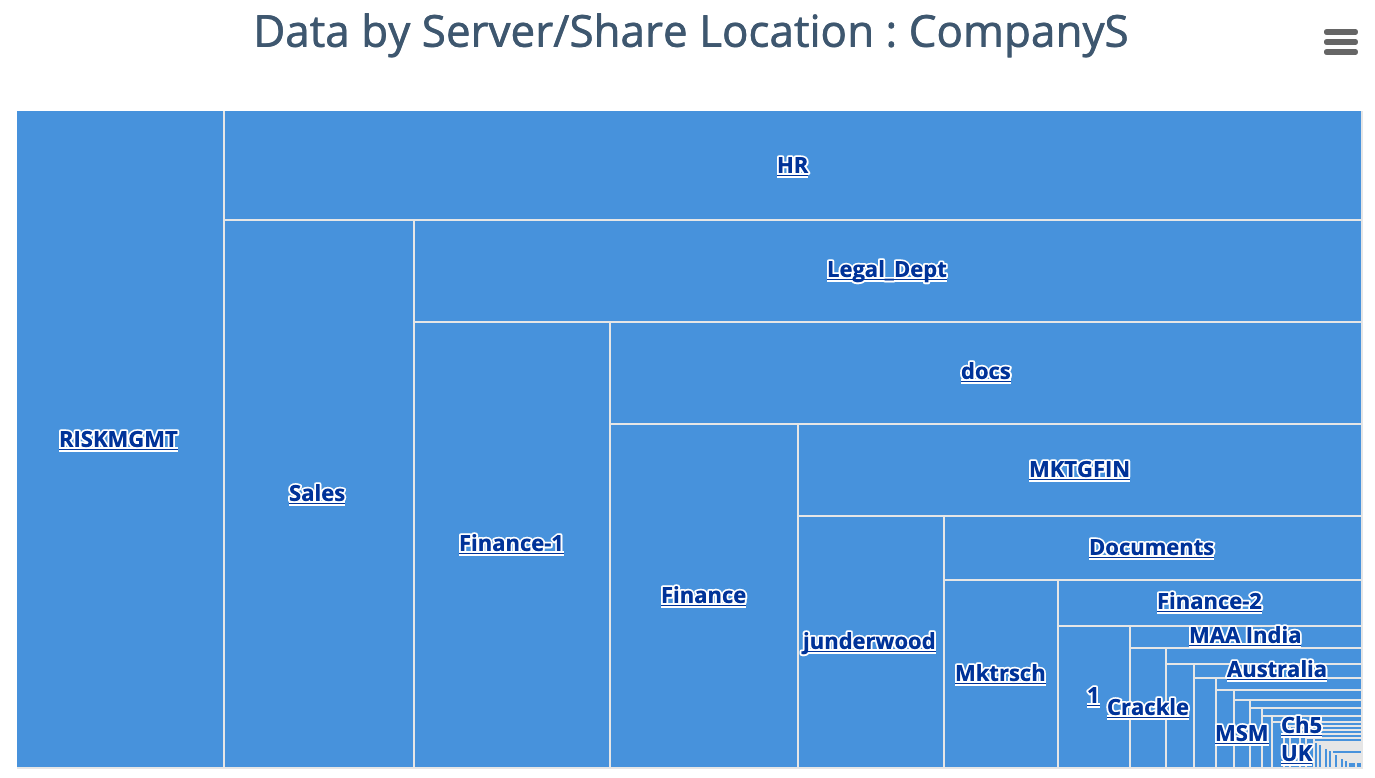
When you reach a ‘leaf’ in the tree, where you cannot drill down any further, the treemap colour changes from blue to orange.
Topics
Word cloud showing the most common topics in your data.

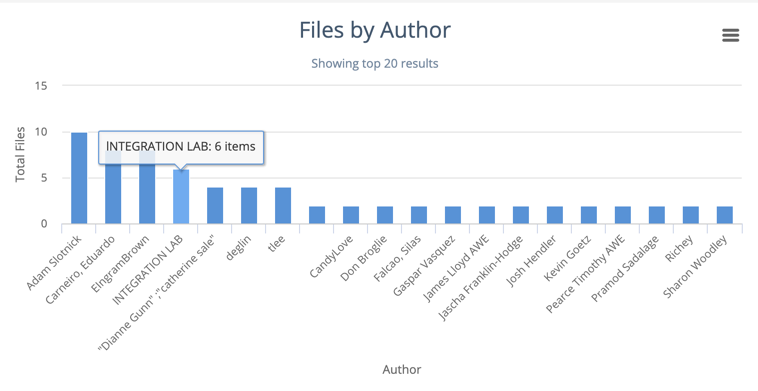
Files by author
Bar chart showing the top authors of content.
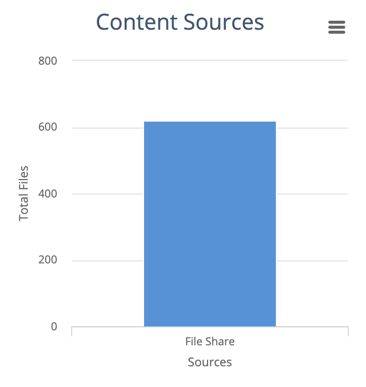
Content sources
Bar chart showing data source types.
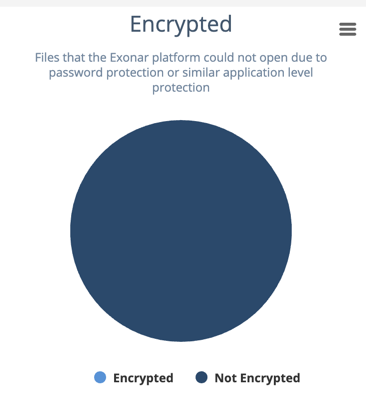
Encrypted
Pie chart showing a breakdown of encrypted and unencrypted files.
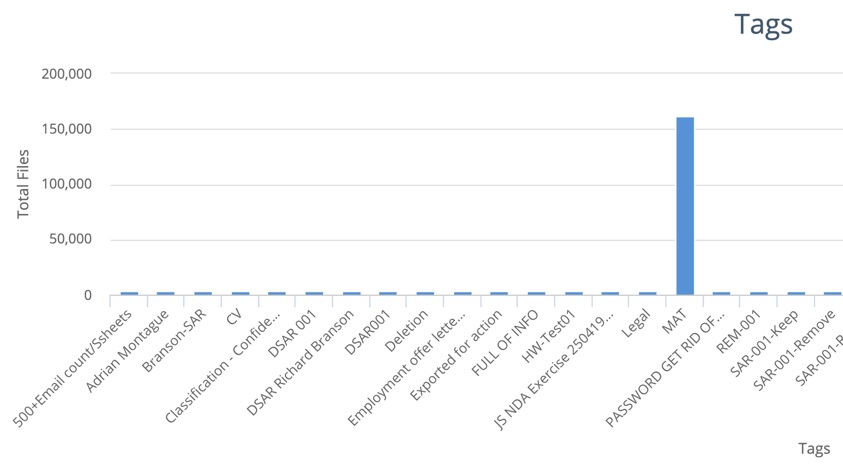
Tags
Bar chart showing the most common tags.
