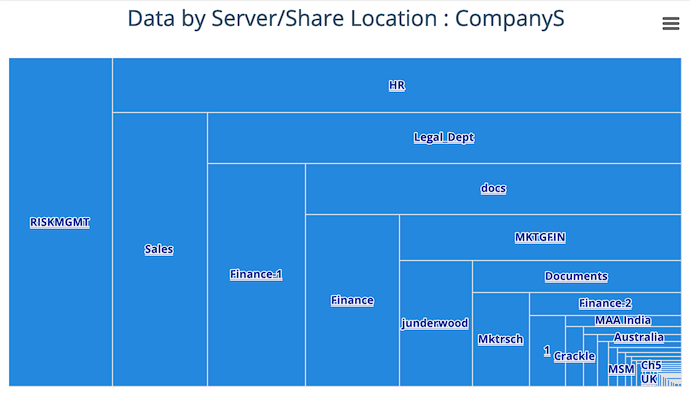
Privacy dashboard
Introduction
The Privacy dashboard has a set of charts that show the most common data that people typically look at when exploring Privacy data.
You can drill down by clicking on a chart. For example, if you click Sensitive Data on the Categories of personal data chart, the dashboard changes; it will show only sensitive data.
Look at the breadcrumbs regularly. Breadcrumbs are your friends.
Total personal data
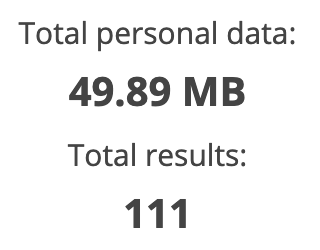
Shows basic statistics for the data currently displayed on the dashboard:
the total file size
the total number of items
As you drill down into the data by clicking on the charts, these figures change. They always represent the data the dashboard is currently showing.
All data
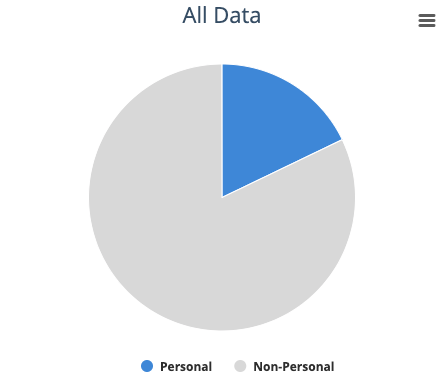
Pie chart showing how much of your data is personal data.
Think of personal data as data that describes a person. For example, a National ID number is personal data.
Non-personal data is data that does not directly describe a person. For example, a credit card number is non-personal data because it might be a corporate credit card.
A note about toggling
You can turn each segment of a pie chart on and off using the labels below the chart.

In this example, the chart has two segments: Sensitive Data and All other personal Data.
If you click All other personal Data, you remove it from the chart, leaving only Sensitive Data. If you click the label again, that segment returns to the chart.
This feature is particularly useful if a segment of a chart is very small compared to the other segments.
Categories of personal data
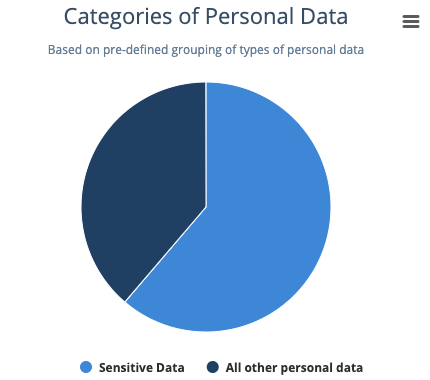
Pie chart showing:
sensitive data
all other personal data
Sensitive data contains:
mentions of religion and ethnicity, or
mentions of religion or ethnicity and at least one item from this list:
people’s names
email addresses
credit cards
National ID numbers
postal codes
telephone numbers
All other personal data contains at least one item from this list:
people’s names
email addresses
credit cards
National ID numbers
postal codes
telephone numbers
Types of personal data
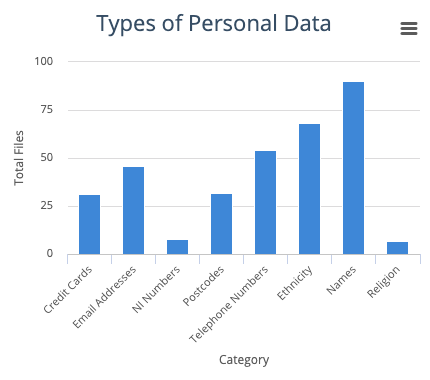
Bar chart showing personal data type:
credit cards
email addresses
national ID numbers
postal codes
telephone numbers
ethnicity
names
religion
Files by last modification age
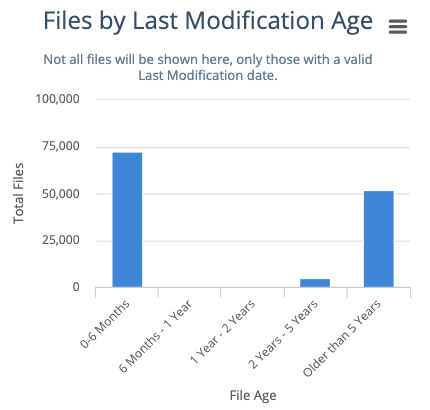
Bar chart showing the date range when files were last modified.
Useful when you’re looking for files that haven’t been modified for a long time.
Top authors of data
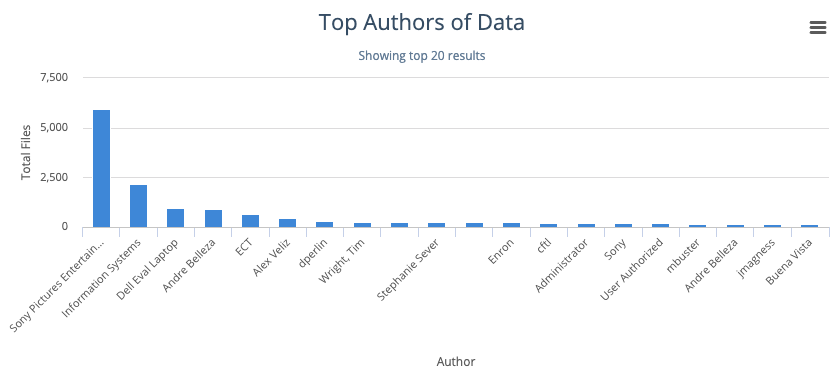
Bar chart showing the top 20 authors represented in the results.
Personal data by data set
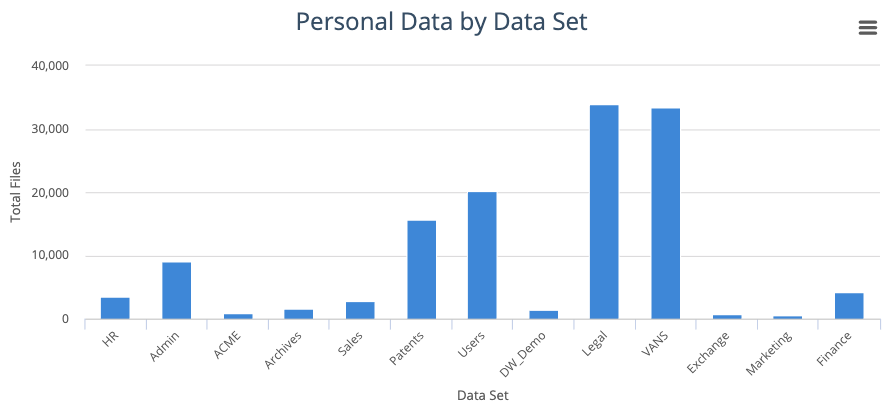
Bar chart showing the top datasets that supply the data currently displayed on the chart.
Topics

Word cloud showing the most common topics in your data.
Data by geo-location
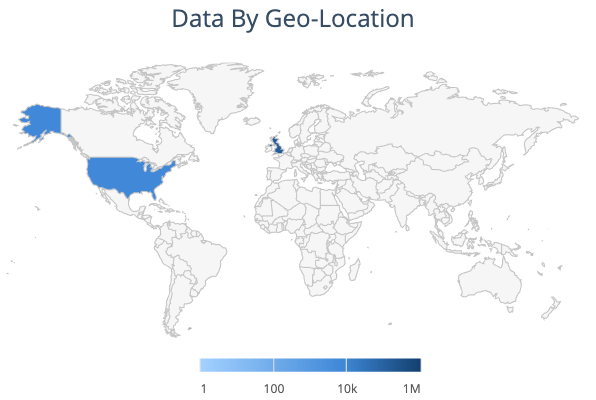
Map showing where in the world the data currently shown on this dashboard comes from.

