Exploring data
Exonar’s dashboards give you a quick and simple way to explore data.
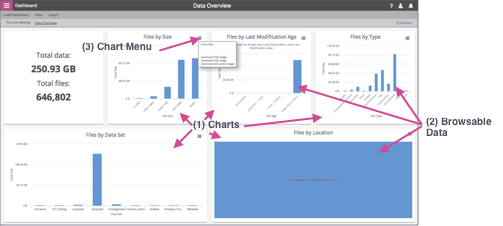
Here’s the Data Overview dashboard:

It has several charts. Each chart has a menu.
You can click any blue component of a chart to drill down into that data.
The first pane shows the total amount of data and the number of files.
As you drill down, the metrics in the first pane change to show the size of your subset of data.
The breadcrumbs above the charts show how you’ve drilled down into the data.
You can also use the breadcrumbs to navigate back up.
