Using dashboards
Dashboards give you an easy and powerful way to explore data.
Here’s a 10-step tutorial to get you started.
Explore the Overview dashboard
From the main menu select Dashboards
Click the Overview icon to go to the Overview dashboard
The statistics pane in the top left shows the total amount of data you can explore here and the file count.
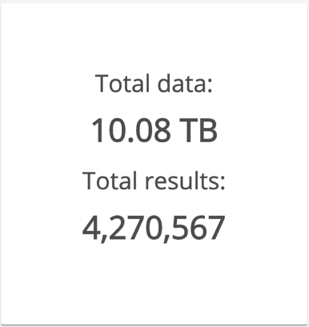
If the statistics are zero, make sure your user is included in one or more security groups. Users who belong to no security groups can see no data.
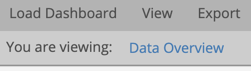
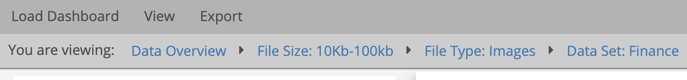
Look at the breadcrumbs. They show that you’re at the top level of the Data Overview dashboard.
On the Files by Size chart, click one of the shorter bars.
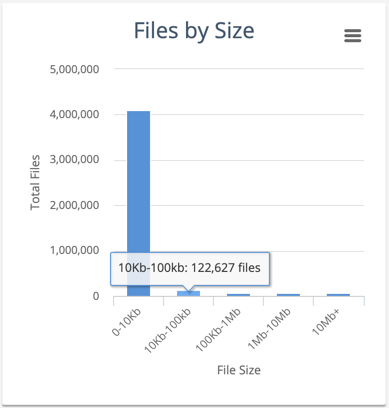
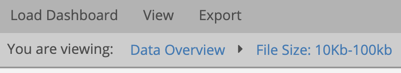
Look at the breadcrumbs again. They show that you’ve drilled down into the data. Now you’re exploring only the data that matches the file size range you selected.
If you look at the statistics again you’ll find the numbers are smaller.
Now choose another chart and drill down.
Watch how the breadcrumbs and statistics pane change.
And drill down one more level.
The breadcrumbs might look something like this now.
Select View ⇾ Show Results Pane.
At the bottom of the screen you’ll see details of the files that match what you’ve selected. Each row is one file.
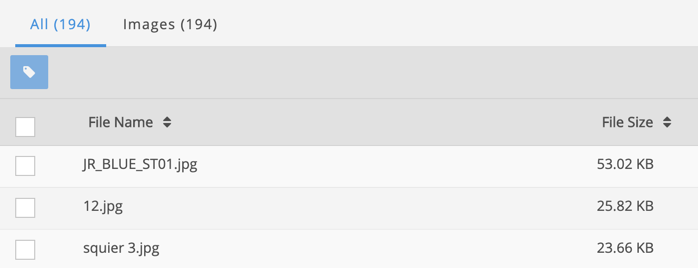
You can use the results pane handle to make the results pane bigger or smaller.

Now click on the breadcrumbs to navigate back up.
The breadcrumbs show you how far you’ve drilled down into your data. But they’re really useful for navigation too.