Duplication dashboard
The Duplication dashboard has a set of charts that show duplicates of data. That is, files that have one or more copies.
You can drill down by clicking on a chart. For example, if you click Spreadsheet on the Duplication by Type chart, the dashboard changes; it will show only duplicated spreadsheets.
Look at the breadcrumbs regularly. Breadcrumbs are your friends.
A note about toggling
You can turn each segment of a pie chart on and off using the labels below the chart.

In this example, the chart has two segments: Sensitive Data and All other personal Data.
If you click All other personal Data, you remove it from the chart, leaving only Sensitive Data. If you click the label again, that segment returns to the chart.
This feature is particularly useful if a segment of a chart is very small compared to the other segments.
Total duplication
Pie chart showing:
duplicated data
non-duplicated data
Duplication by type
Bar chart showing duplication by file type. For example:
spreadsheets
email messages
images
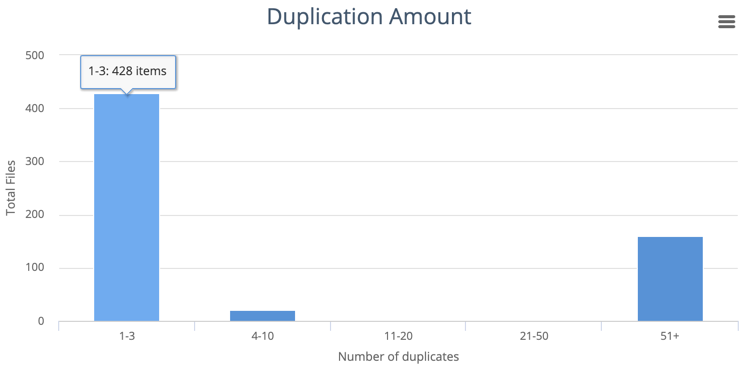
Duplication amount
Bar chart showing how many copies of duplicate files exist.

This chart shows that 428 files have one to three duplicates.
